Digital adspend grows at fastest rate for seven years
UK digital adspend grew 16.4% in 2015 to over £8.6bn with the average home now owning 8.3 internet devices.
The full research deck is available here (IAB members only)
Advertisers spent a record £8.61 billion on UK digital advertising in 2015 – up 16.4%¹ – as ownership of internet devices increases, according to the latest Internet Advertising Bureau UK Digital Adspend report, conducted by PwC. The report is accompanied by online YouGov consumer data.
The 16.4% year-on-year rise in spend was the highest rate since 2008 (17.1%), as the number of internet-enabled devices per household increased 12% in a year to 8.3² per UK household. Connected TVs saw the biggest rise in ownership (27%) followed by smartphones (21%), whilst laptops (18%) outgrew tablets (16%). Smartphones are the most popular internet device (2.1 per household) followed by laptops (1.6) and tablets (1.4).
Fastest-growing digital ad formats
Mobile accounted for the vast majority (78%) of digital ad spend growth, increasing 60.3% year-on-year to £2.63bn – or 30.5% of all digital advertising.
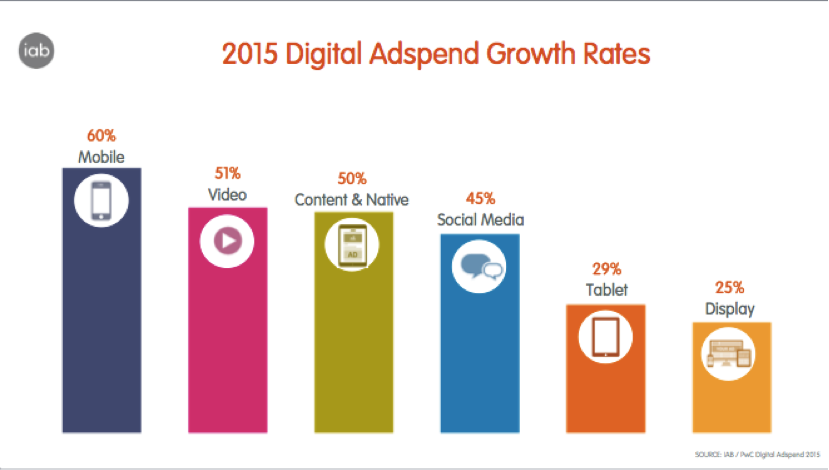
Video ad spend, overall, grew 50.7% to £711 million whilst video spend on mobile alone increased by 98% to £353 million due to the increasing numbers of people watching video, TV and film on smartphones.
Content and native advertising spend – which includes ‘advertorials’ and ads in social media news feeds – increased by 49.9% to £776 million.
Ad spend on social media sites grew 45% to £1.25bn – now accounting for 41% of banner/video display ad spend. Over 71% of social media spend goes on mobile.
“The increasing array of devices people use to go online has helped digital ad spend hit another gear as advertisers look to reach them and time spent online increases,” says Tim Elkington, Chief Strategy Officer at the UK’s Internet Advertising Bureau. “Smartphones are the major driving force behind this, as people increasingly use them for activities they used to do on desktop, from searching and shopping to social and watching video.”
Majority of display now programmatic
Display ad spend rose 24.5% year-on-year to reach a 35% share (£3.03bn) of digital ad spend. The share traded programmatically rose from 47% in 2014 to 60% (£1.60bn) in 2015.
Direct sales – where ads are bought at fixed prices directly from media owners using manual processes – now represent just 37% of display ads (down from 47%) while ad networks make up the remaining 4%.
“We’re seeing a three-pronged change in media owner strategy when it comes to selling display ads,” says Dan Bunyan, Senior Manager at PwC. “There’s a shift in sales from networks to Real-Time-Bidding exchanges, a shift from direct to programmatic direct, and one from open to private market places. It’s almost gone full circle in terms of the desire for a more controlled environment to sell in. We predict programmatic will account for 80-90% of display ad sales by 2019.”
Consumer goods are biggest display advertisers
Consumer goods, such as food, toiletries and clothing, companies spent the most on banner and video display ads in 2015, responsible for 18% of spend, followed by travel & transport (13.4%) and retailers (13.3%).
Paid-for search grew 15.3% to £4.36bn – a 51% share of digital ad spend. Classifieds, including recruitment, property and automotive listings, grew 5.2% to £1.11bn (13% share).
Advertisers spend nearly another billion through ‘deal’ websites
In addition to the £8.61bn going on ad spend in 2015, advertisers spent a further £953 million to attract customers via activities on ‘shopper’ websites such as price comparison, voucher, cashback, loyalty and product review sites.
Known as ‘online performance marketing’, 75%² of adults online have undertaken at least one of the OPM activities listed in the last six months, with usage of price comparison sites (40%) the most popular activity, followed by entering a competition (35%) or using a voucher code site (26%).
Spend³ on OPM generated £17.7 billion in sales – a return of £13 for every £1 spent – equivalent to around 10%⁴ of all UK e-commerce retail sales and 1%⁵ of GDP.
ENDS
Notes to editors
Definitions:
¹All growth rates unless stated are a like-for-like basis (except for content/native), i.e. only companies that submitted in 2014 and 2015 have been included in year-on-year growth calculations.
²Source: YouGov Plc. Total sample size was 2049 adults. Survey was conducted online during 19-22nd February, 2016. The figures have been weighted and are representative of all GB adults (aged 18+). The previous wave was conducted 16th – 17th March 2015, with a sample size of 2,090.
³Total OPM spend including media ad spend in this area = £1.3 billion
⁴Based on Verdict Retail (2015)
5Assumed GDP of c. £1.85 trillion (IMF, Oct 2015)
Related content

Digital’s share grows to 74% of UK advertising spend
Learn more
ISBA/PwC: Update on stage two of the Programmatic Supply Chain Transparency study
Learn more
What does P&G’s ‘Time for Action’ speech mean for UK advertisers?
Learn more
Outlook 2022: 3 key insights for the year ahead
Learn more
State of AI in Advertising: Charting the Shift from Automation to Autonomy
Explore how AI is reshaping advertising, from autonomous systems to changing consumer discovery, with key findings, deeper analysis and latest industry commentary in this report